How to Measure ROI of AI Content Creation
AI can speed up content, but is it paying off? This guide shows how to measure ROI the right way – costs vs. value, fair attribution, before/after tests, and a quick calculator you can reuse.

ROI keeps your content honest. It tells you what's working, what's wasting time, and where to invest next. AI raises the stakes: it can cut costs and speed up production, but it also introduces new expenses, quality checks, and measurement wrinkles. McKinsey's latest global survey shows 65% of companies regularly use generative AI, up sharply from 2023, which is evidence that measurement needs to keep pace with adoption.
In this guide, we'll first nail the fundamentals of content ROI – how to define value, count costs, and attribute impact – then layer AI on top to show exactly how to measure ROI for AI-generated content. You'll leave with a practical framework you can apply to your next brief, campaign, or quarterly review.
What is ROI, and how do we measure it?
Definition & Core Formula
ROI measures the return you get for every unit of investment: ROI = (Value generated - Total cost) / Total cost.
ROI (Return on Investment) is the big-picture metric for any investment. Use it to compare initiatives on equal footing – e.g., a blog program vs. a webinar series vs. paid ads – because it shows how much value you earned relative to what you spent.
ROMI (Return on Marketing Investment) applies the same idea specifically to marketing spend (content production, promotion, tools). It helps you see which channels or campaigns use the budget most efficiently and should get more (or less) investment.
Payback period tells you how long it takes to earn back what you spent. It's a cash-flow view: faster payback means you recover costs sooner and can reinvest earlier.
What Counts as Cost
For cleaner analysis, count all relevant inputs and separate direct from indirect costs.
Direct costs (clearly tied to a piece/campaign):
- Freelance writer/editor fees
- Design/video production
- Paid distribution/ads for that asset
- Stock images, transcription, translations
- Specific research/surveys used for the piece
Indirect costs (shared or overhead):
- Team time (salaries × hours spent on content)
- Tools/licenses (CMS, SEO, analytics, scheduling)
- Brand/strategy time allocated across multiple assets
- Management/QA/review time
What Counts as Value
Value can be direct revenue (e.g., purchases after a click) or attributed value from leads that convert downstream. In B2B, translate leads to expected revenue using historical conversion rates and deal values (or LTV). In e-commerce, map content touchpoints to assisted revenue where content played a meaningful role in the path to purchase.
Attribution & Time Window
Attribution is simply how you assign credit to content that influenced a conversion. Most journeys have multiple touches (search → blog → newsletter → pricing page → demo), so you need a rule to split the credit fairly. If you’re planning for next year’s shifts in search and discovery, this guide on how AI will impact content marketing in 2026 can help you pick an attribution model that fits emerging journeys.
Here are some common models (and when to use them):
- Last click: 100% credit to the final touch before conversion. Good for short, intent-heavy journeys (e.g., pricing page → sign-up). Risk: undervalues top-funnel content.
- First click: 100% credit to the first touch. Good for evaluating acquisition channels. Risk: ignores nurturing content that actually closes.
- Linear: equal credit to all touches. Good for early-stage programs where you want neutrality. Risk: treats minor and major touches the same.
- Time-decay: more credit to touches closer to conversion. Good for longer cycles where recency matters. Risk: still may under-credit the first discovery.
- Position-based (U-shape / W-shape): extra weight to first and last (U), or to first, key middle, and last (W). Good for content-led funnels (SEO + nurture + conversion). Risk: the weight split is just a rule of thumb, the "key middle" is subjective, it can over-reward first/last touches (easy to game), and results can swing with your conversion window or missing tracking.
Besides that, keep it practical.
- Pick one model and stick with it for at least a quarter so the results are comparable.
- Define a conversion window to avoid over-attributing very old interactions.
- Match the model to the motion: SEO + nurture often fits position-based; short DTC paths might tolerate last click; complex B2B cycles benefit from time-decay or W-shape.
Here are some additional tips you might want to consider.
- Tag everything with UTMs and track events so touches are visible.
- Separate assisted conversions in reporting to see where content supports (not just closes).
- For day-to-day reporting, HubSpot's multi-touch attribution tools can help you see how content assists conversions across the journey.
- Revisit the model only when your sales cycle or mix of channels changes meaningfully.
How do we measure the ROI in content marketing?
Measuring ROI in content marketing isn't the same as a one-and-done campaign calc. Content compounds over time (SEO, links, evergreen), influences buyers across multiple touches, and serves both brand and performance goals.
That means you need cleaner cost allocation, multi-touch attribution, and a longer evaluation window. In this section, we'll set that foundation: how to structure costs, define value and KPIs, apply attribution, and run a simple, repeatable measurement plan.
Content-Specific Dynamics
Content compounds over time: SEO rankings, links, and evergreen pieces build momentum. Set separate goals for brand (reach, share of search) and performance (leads, sales) so you don't judge awareness assets by bottom-funnel metrics.
Cost Structure for Content
Capture costs consistently: production (writing/editing/design), distribution (paid/owned), tools (CMS/SEO/analytics), and internal time. Standardize costing per asset or per topic cluster to keep attribution clean.
Measuring Value from Content
Track KPIs across the funnel: acquisition (organic sessions, rankings), engagement (CTR, time on page), conversion (forms, trials, purchases), and value (revenue, lead value, LTV). Use your chosen attribution model to assign assisted credit.
Minimal Measurement Plan
Define goals, map the journey, implement tracking, choose attribution, agree on lead values, set an evaluation cadence, and – last but not least - report consistently.
How do we measure the ROI of AI Content Creation?
Measuring ROI for AI content doesn't require a new playbook – you just need to extend the standard content ROI model.
What Changes in Inputs (Costs)
AI adds new cost lines: tool licenses, prompt work, human QA/editing, team training…
Besides adding new costs, it also creates savings: fewer hours for ideation, outlines, first drafts, and repurposing.
The key is to track before/after time and cost per asset (or per topic cluster) so you can clearly measure the difference in time and cost.
What Changes in Outputs (Results)
When using AI in content creation, you can expect shifts in volume, quality, and speed. Many of these gains (volume, speed, consistency) come from AI content engines that turn insights into publish-ready assets. You can publish more assets without extra headcount, apply stronger structure/SEO scaffolding with human editing to maintain a tone, and cut time-to-publish, which brings impact forward in the pipeline.
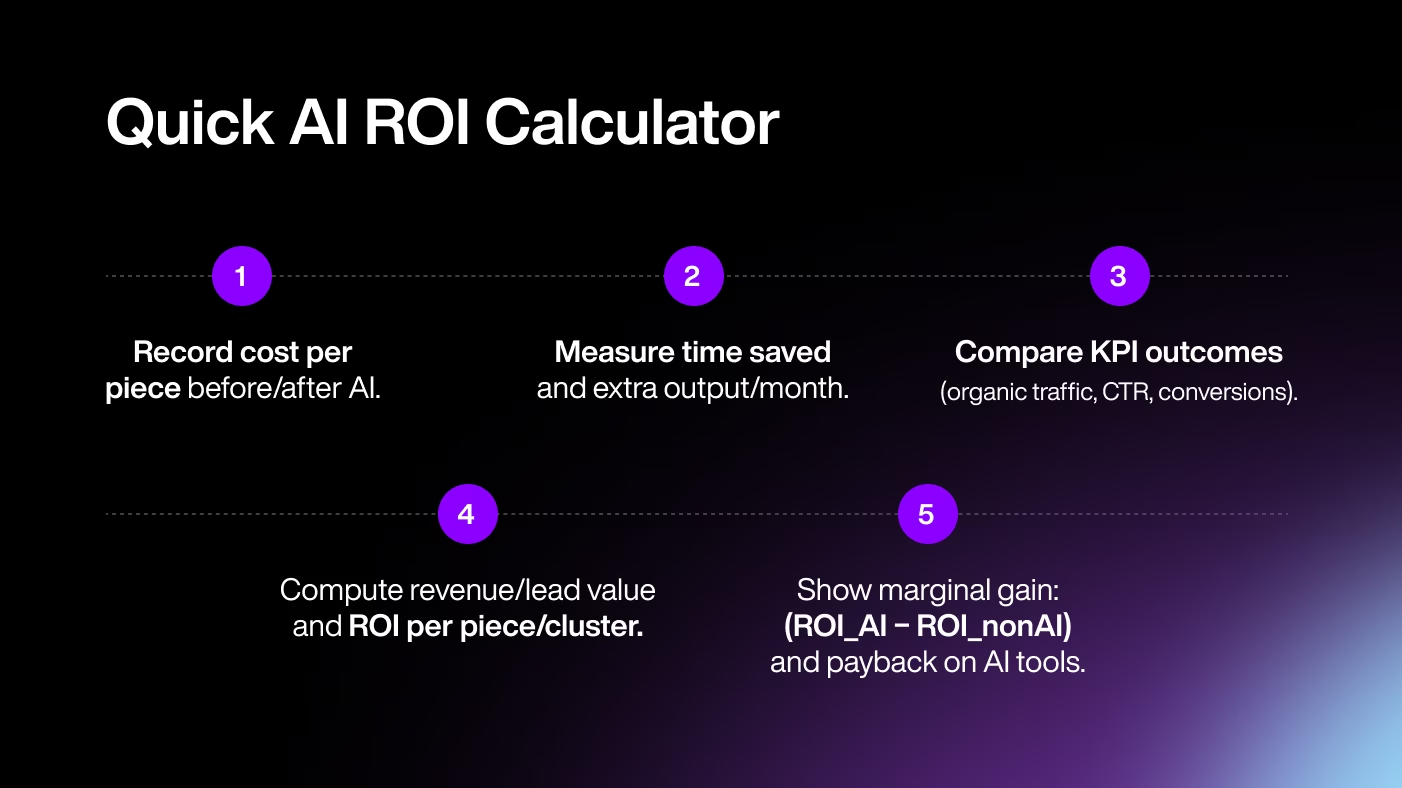
Calculation Model (AI vs. Non-AI)
The calculation model, in which you'll be comparing AI vs. non-AI, is like a simple before/after check for each piece of content.
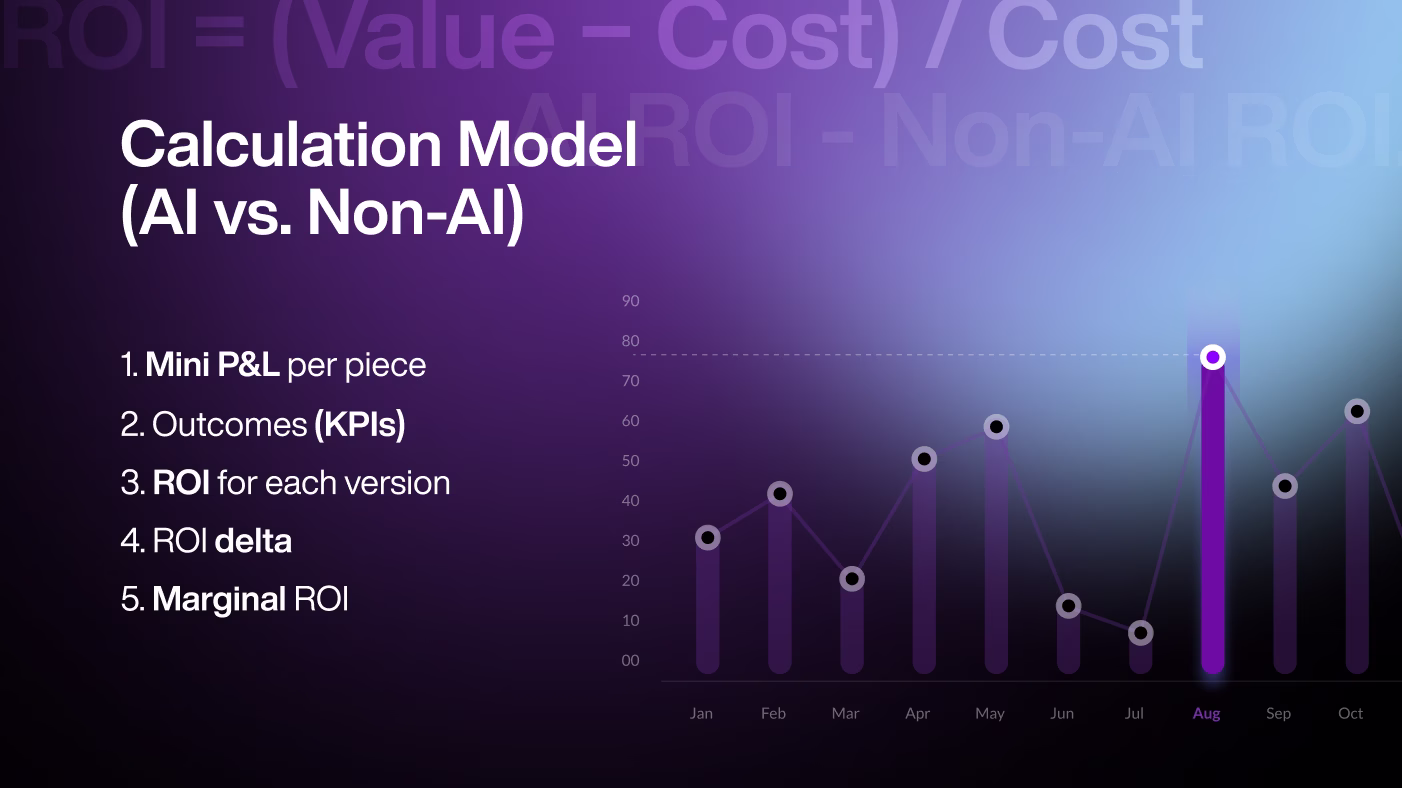
Here's how you can do it:
Make a mini P&L per piece: a mini P&L is a tiny income statement for one post. List costs (hours x rate, freelancers, tools – including AI) and value (sales or lead value the post generated).
Add the outcomes (KPIs): note traffic, leads, conversions, so you can see why the value changed.
Calculate ROI for each version: ROI = (Value - Cost) / Cost.
Find the ROI delta: that's the difference: AI ROI - Non-AI ROI.
Add marginal ROI: show the extra profit from extra pieces you can now publish because AI saves time/cost.
Control Groups & Timeframe
Run a simple, fair test. Either do an A/B setup (some topics produced with AI, similar topics without AI at the same time) or a pre–post setup (publish a batch without AI, then a comparable batch with AI). Keep everything else the same – publish cadence, promotion budget, channels, and timing – so AI is the only meaningful difference. Let the test run 8–12 weeks to cover SEO indexing and compounding effects. Then compare costs, time, and KPIs (traffic, leads, conversions) between groups to see the real lift.
Conclusion
Bottom line: measure the basics, then layer AI on top. Know your costs, define the value, and set the rules for attribution and timing. Then track what AI changes: new costs, time saved, output, and performance.
Start small (one workflow, one 8–12 week test), measure it cleanly, and double down on what actually moves the needle. If it helps you grow smarter and faster, just keep going.